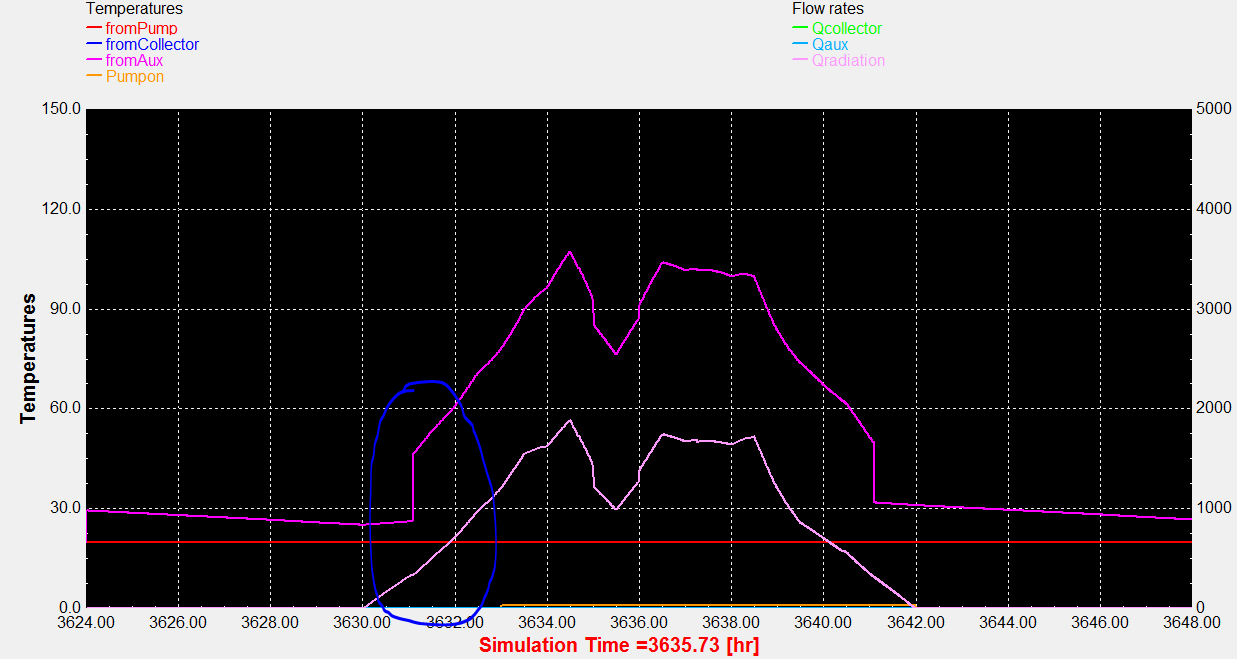
Anand,
When you are looking at the Type65 plot window, hold down both the ctrl and shift keys and the line labels will be replaced with the actual value of each output. What you are looking at on the screen is a plot of values that are visually interpolated between actual values at each time step. It may be that the stagnation temperature jumps at the same time that radiation is incident on the collector surface in such quantity that the gains outweigh the thermal losses of the collector but that the plot confuses things a bit by its visual interpolation.
kind regards,
David
Hi Everyone,Working on the Begin Example in TRNSYS over a days interval. Having switched off the pump please can anyone explain why the stagnation temperature spike(attached screenshot) appears only after the incident radiation crosses 340Kj/hr? This is different from my calculated values for the same.
Please advise and bear with me as i am only a beginner.
Regards,Anand
_______________________________________________ TRNSYS-users mailing list TRNSYS-users@lists.onebuilding.org http://lists.onebuilding.org/listinfo.cgi/trnsys-users-onebuilding.org
-- *************************** David BRADLEY Principal Thermal Energy Systems Specialists, LLC 3 North Pinckney Street - suite 202 Madison, WI 53703 USA P:+1.608.274.2577 F:+1.608.278.1475 d.bradley@tess-inc.com http://www.tess-inc.com http://www.trnsys.com