Dear Toni,
Trnsys18 has already been validated in several studies against E + and others. Your deviations seem to me quite high, as you already have noticed.
It's best to send us your project to hotline@transsolar.com and we'll take a closer look.
Best,
Christoph
__________________________________________________________________________________________________
Transsolar Energietechnik GmbH
Curiestraße 2
70563 Stuttgart
Transsolar: KlimaEngineering- Technologien für energieeffizientes Bauen und
Nutzerkomfort in Gebäuden
Stuttgart – München – New York – Paris
Geschäftsführer :Diplom-Ingenieur Matthias Schuler, Diplom-Ingenieur Thomas Auer, Diplom-Physiker Stefan Holst, Diplom-Betriebswirt Dieter
Schnelle
Eingetragen beim Amtsgericht Stuttgart HRB 23347,
Steuernummer: 99073/00911,USt-IdNr.: DE 152272639
The simulation project you have sent will be stored on the local servers of Transsolar Energietechnik GmbH for the duration of the project support.
Our employees are obliged by us to confidentiality. After this period, all project-related data is deleted.
The storage of your personal e-mail and other contact information is based on the mutual interest in the execution of this traffic
and on a mutual business contact. If you have any questions, please contact our data protection officer at
privacy@transsolar.com.
Our privacy policy can be found
here.
Von: TRNSYS-users <trnsys-users-bounces@lists.onebuilding.org>
Im Auftrag von Toni Calabrese via TRNSYS-users
Gesendet: Donnerstag, 9. August 2018 11:55
An: trnsys-users@lists.onebuilding.org
Cc: Toni Calabrese <calabresetoni@live.com>
Betreff: [TRNSYS-users] Comparison of TRNSYS with others tools
Hi,
we work at the University of Innsbruck and we are doing a comparison work between the simulation results of different simulation tools (TRNSYS, carnot/Simulink, Energy+) for an office building.
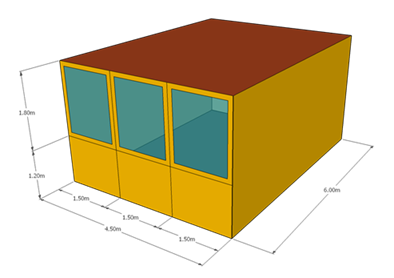
Below the sketch of the office building model (floor area of 27 m2 and volume of 81 m3). The office is located in STOCKHOLM and just the wall oriented to the South (surface
“1” in the sketch) can transmit heat, while all the others five surfaces were modelled as adiabatic (BOUNDARY/identical in TRNSYS). The reference glazing assembly
WIN-ID 2206 is used for the window on the surface “1”. A simulation of 1 year was performed assuming a set point temperature of 21 °C and 25 °C for winter and summer, respectively.
![]()

The Table below shows the annual comparison for the three tools investigated. We are trying to understand why there is this relevant deviation in the calculation of the transmission losses (in
the table the total transmission losses are reported, i.e. WALL+WINDOW) between TRNSYS and the others two tools. We also founded out that this deviation is due to the difference in the transmission losses of the window calculated in the three tools, while
the transmission losses just of the opaque structure are comparable in the three tools. We are trying to understand this aspect. Why the transmission losses of the window are much higher in TRNSYS compared to the others tools? Could it be due to the glazing
assembly used or maybe TRNSYS is able to take into account some phenomenon that the others two tools do not consider?
Did you have some experience to share with us?
|
Heating |
Cooling |
Infiltr. |
Ventil. |
Transm. |
Int. gains |
Solar gains |
|
|
[kWh/(m2y)] |
|||||||
|
carnot/Simulink |
13.80 |
-31.07 |
-21.14 |
-32.33 |
-41.95 |
56.52 |
56.18 |
|
Trnsys |
21.32 |
-23.79 |
-20.02 |
-30.43 |
-61.62 |
56.52 |
58.04 |
|
Energy+ |
16.78 |
-32.69 |
-21.31 |
-29.12 |
-37.17 |
57.48 |
46.03 |
Thanks in advance for your time and availability.
Mara Magni
Toni Calabrese
Fabian Ochs

Toni Calabrese
Wissenschaftlicher Mitarbeiter
AB Energieeffizientes Bauen
Institut für Konstruktion und Materialwissenschaften
Universität Innsbruck
Technikerstrasse 13, 5.Stock, Raum 510
A-6020 Innsbruck
Tel: +43 67761597355
mailto:
Toni.Calabrese@uibk.ac.at
http://www.uibk.ac.at/bauphysik/