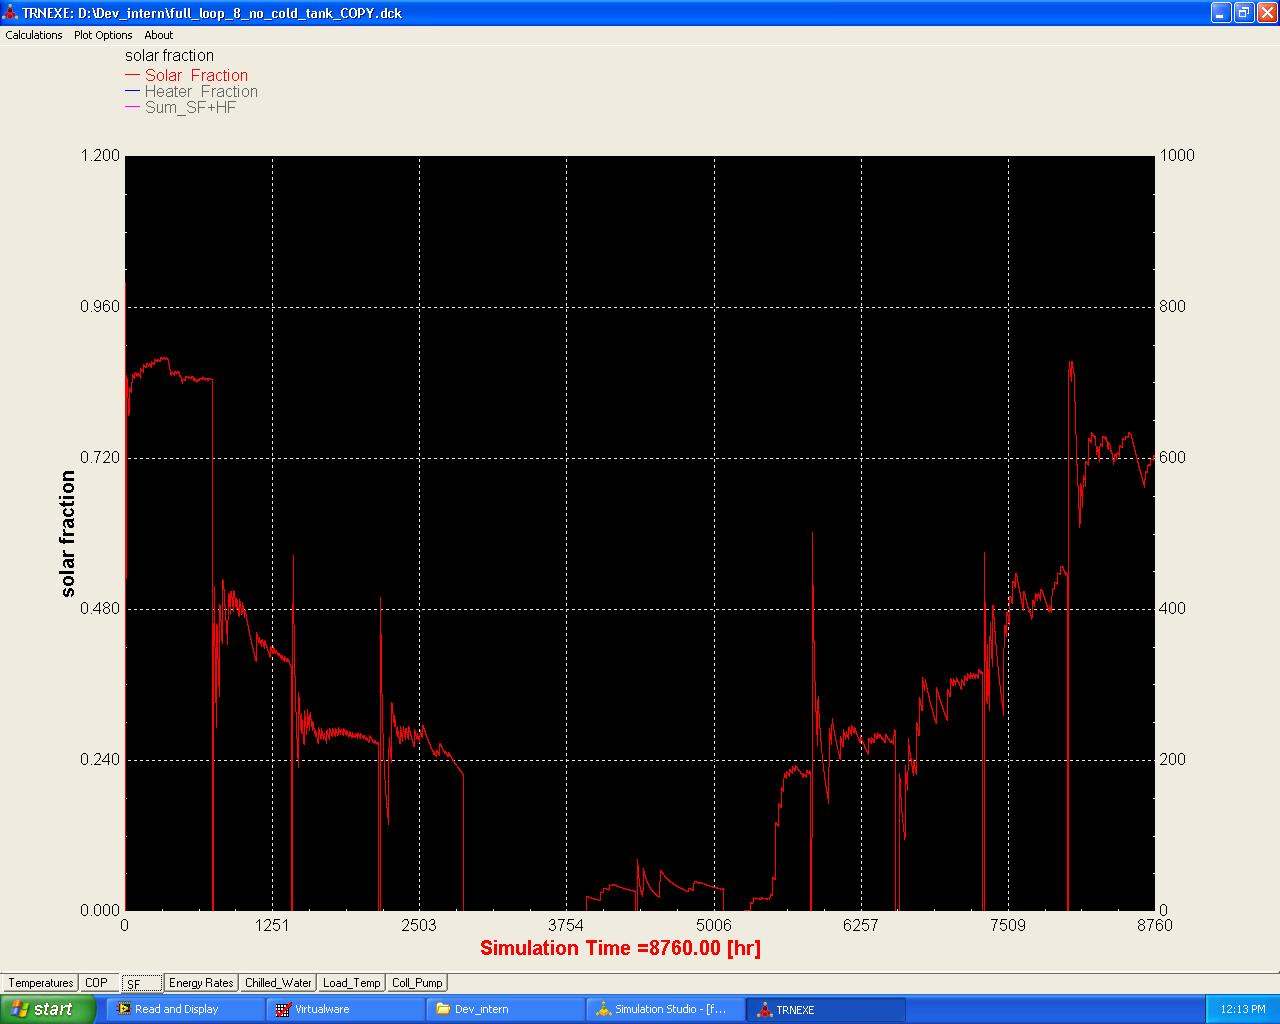
Hello All,

I am simulating a Solar Collector based Absorption Chiller model for
my Master's thesis. The solar fraction when plotted over the year
gives a very weird shaped curve. It becomes 0 during the summers, when
it should've been higher instead. Load is simulated as a constant
value in this model, hence that is not an issue.

I have been trying to find the bug for a while now, with no luck. It
would be great help if someone can point out where the error is in the
model.

I am attaching the model files and the screenshot of the solar fraction curve.

Eagerly awaiting someone's reply.

Thanks
Dev

--
Dev Sharma
Erasmus Mundus Masters in Sustainable Energy
KTH, Stockholm & UPC, Barcelona
Mobile: +34635104882 (Spain)
Attachment:
Solar_fraction_year.JPG
Description: JPEG image
Attachment:
Model.zipx
Description: Zip compressed data