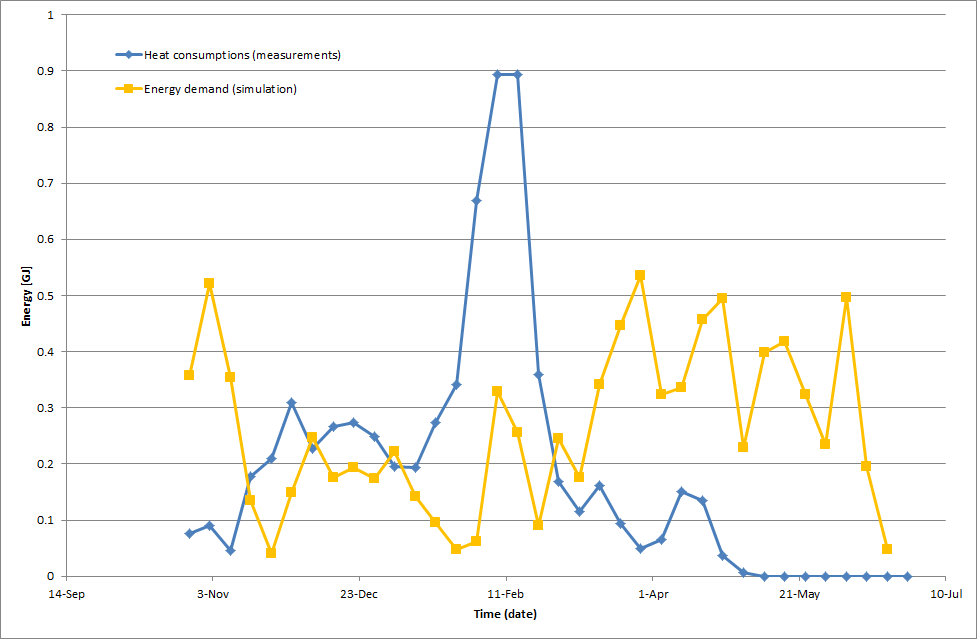
Dear All, I simulate the dwelling in TRNSYS. Last time a try to validate my model and I compare simulation results with measurements. Heat consumption has been measured in dwelling every week (the same day of week and the same hour). Trnsys simulation generate results for dwelling’s model with ideal heating assumptions (set temperature 20/21) –NTYPE2 (sensible energy demand). Total heat consumption (measurements) of dwelling and energy demand (simulation) of simulated model are quite similar (36 weeks from September to June), but if we look on weekly results there are bigger difference with interesting regularity: if heat consumption decreases from one week to the next, then energy demand increase, and vice versa (I enclose graph). Could you tell me what can cause this lack of coincidence? I will be grateful for any hints! Regards, Karol ------------------------------------------------ Karol Bandurski MSc. Institute of Environmental Engineering Poznan University of Technology |
Attachment:
validation_h.png
Description: PNG image
Attachment:
validation_t.png
Description: PNG image